
139 eCommerce Statistics eMarketers Need to Know in 2021!


What can eCommerce statistics do to help you attract a loyal following and sell more of your product than ever before?
Answer: A lot!
But if the thought of trying to find eCommerce statistics seems overwhelming, you’ve come to the right place.
Think of this as insider information. We’re going to tell you exactly what statistics are important for the eCommerce market.
When you know what turns curious browsers into happy customers, you can bridge the chasm between “Just looking” and “How soon will it get here?”
Read on if you’re ready to make that happen.
General eCommerce Statistics
Let’s start with some general eCommerce stats to provide a big picture view of the eCommerce landscape.
What consumer habits and preferences could have the biggest impact on your sales and growth this year? What percentage of people use eCommerce?
And what are your competitors doing that you’re not?
General Business Statistics:
- At least 18% of all retail sales in 2020 happened online (i.e., via eCommerce). That number is expected to reach 21.8% by 2024.
- 18.1% of worldwide retail sales are expected to be eCommerce sales in 2021.
- The number of global digital buyers is projected to reach 2.14 billion - roughly 27.2% of the total global population - in 2021.
- Almost half of US small businesses still do not have a functioning website, despite the 23% year-over-year growth of the eCommerce industry.
- 68% of small businesses have yet to develop a clear, structured, and documented conversion rate optimization (CRO) strategy.
- 52% of online stores have developed omnichannel capabilities (selling on multiple platforms like social media, online store, app, etc.).
- By 2040, 95% of all purchases will be eCommerce transactions.
- Sales on Amazon alone account for nearly a third of all US eCommerce sales growth in 2020 - down from its 43.8% share in 2019.
- 50% of retail sales in 2021 will be through Amazon.
- The top 100 retailers (minus Amazon) had a 74.1% share of eCommerce growth in 2020, up from a 49.4% share in 2019.
- The conversion rate of eCommerce purchases is 2.17%
- Conversions increase by 250% if a product image is in 3D.
- In 2022, eCommerce sales are expected to grow to $5.4 trillion!
- eCommerce conversions average 4.76% with popups.
- The optimal number of input fields in popups is two.
- In 2021, China is expected to account for one-third of digital buyers and produce $2.8 trillion in eCommerce sales.
- The US ranks second with an impressive $340 billion in annual sales. The rest of the top 10 is as follows:
- The UK ($99 billion)
- Japan ($79 billion)
- Germany (73 billion)
- France ($43 billion)
- South Korea ($37 billion)
- Canada ($360 billion)
- Russia ($20 billion)
- Brazil ($18 billion)
- 69% of B2B businesses plan to stop printing catalogs in the next 5 years.
- If you’re looking for a reason to personalize your eCommerce site, perhaps the $756 billion in lost revenue last year will convince you.
General Consumer Statistics:
Consumer behavior and expectations have changed dramatically over recent decades. The more you know about what they want, the easier it is to keep up.
- 93.5% of global internet users have made online purchases.
- 61% of online consumers in the US have made a purchase based on a blog recommendation.
- Free shipping is the number one reason most people shop online.
- The fact that shoppers can shop online at all hours of the day is also a big factor.
- 81% of consumers research a product or service online before making a purchase; 68% of that research happens on Google.
- Similarly, 81% of consumers take the advice of friends and family instead of businesses.
- 58% of consumers stop doing business with a company after one negative experience with them.
- Consumers are most likely to trust your business if they can easily contact you.
- Only 1.85% of online store visits end in a purchase.
- Fashion consumers view a whopping 32 pages before making a purchase.
- 76% of shoppers prefer to do their shopping at a physical store for the holidays.
- 48% of consumers head straight to a large online retailer to do their online shopping.
- Millennials aged 25 to 34 years were the biggest group of online shoppers in 2020, followed by 35 to 44-year-olds.
- On average, men spend 68% more online than women.
- 68% of women read product reviews before making a purchase.
- In 2018, 59% of 16-36 year-olds went to Amazon first when shopping online.
- 85% of consumers start a purchase on one device and complete it on another.
- In the United States, 41% of consumers receive 1 to 2 packages from Amazon each week. That number jumps to 50% for those aged 18-25, and 57% for 26-35-year-olds.
- 43% of online shoppers value in-stock availability first, and fast delivery second.
- 71% of repeat purchases take place online.
- What are online shoppers buying the most? In 2020, largely due to Covid-19, the fastest-growing niches were bread machines and disposable gloves.
- 6 out of 10 Americans prefer to take care of their concerns using self-service tools on websites (24%), mobile apps (14%), VoIP (13%), and online live chats (12%).
- 32% of eCommerce consumers have at least one device connected at home.
Email eCommerce Statistics
Every email you send out to your subscribers should give them a reason to open it. And every email should entice them to visit your online store and check out the latest deals and new arrivals.
But what makes email so powerful? And how does its ROI compare to other marketing tools?
- For 61% of consumers, email is how they prefer to be contacted by brands; 25% prefer to be contacted via social media.
- 73% of Millennials prefer to interact with businesses via email.
- That said, non-Millennials are more likely to give promotional emails credit for impacting their purchasing decisions.
- 49% of consumers would like to receive weekly promotional emails from their favorite brands.
- 60% of consumers subscribe to a brand’s email list to get promotional messages and special deals.
- 60% of consumers have made a purchase because of an email marketing message they received.
- 93% of online consumers in the US receive at least one permission-based email a day from businesses.
- 30% of consumers would rather buy from a website or online marketplace they’ve bought from previously.
- The average conversion rate of abandoned cart emails sent within 20 minutes is 5.2% - compared to 2.6% for emails sent 24+ hours later.
- Sending three abandoned cart emails yields 69% more orders than sending just one.
- February has the best email open rates (17.9%); June has the best click-through rates (3.6%).
- Email marketing has a 4400% ROI, returning $44 for each $1 spent.
- 58% of the top 1,000 online retailers in the US send welcome emails.
- Segmented email campaigns drive a 760% increase in revenue.
- 20% of traffic driving eCommerce sales come from email marketing.
- Personalized emails get 6X the transaction rate of generic emails - yet only 30% of businesses use them.
- Adding video clips to emails can boost click-through rates (CTR) by as much as 300%.
- 50% of small and medium-sized businesses use email marketing automation software (ConvertKit, Mailchimp, etc.) to send drip campaigns.
- B2B eCommerce sites credit compelling content in email campaigns for their success.
- In 2018, 24% of holiday sales were through email campaigns.
- Spam filters that block fundraising email campaigns cost nonprofits about $15K per year.
- Transactional emails have 8X more open and click rates and make 6X the money than other email campaigns.
Email vs. Social Media
- The average open rate for email is 22.86%, with a click-through rate (CTR) of 3.71% - soaring over social media’s 0.58% CTR.
- An email campaign is 6X more likely to get click-through engagement than a tweet.
- Email subscribers are 3X more likely to share your content on social media than non-subscribers.
- An email message is 5X more likely to be seen than a Facebook post.
Social Media eCommerce Statistics
The following statistics shed some light on consumer behavior and how social media influences their buying decisions.
For example, do you know whether your ideal consumers buy products on Facebook or Instagram? And how many retailers rely on social media for a significant share of their sales?
- Gen Z and Millennials are most likely to credit social media influence for an online purchase.
- Online retailers with at least one active social media account make 32% more sales than those that don’t use social media platforms.
- 1 in 4 companies is selling items on Facebook.
- Facebook dominates orders from social media sites at 85%.
- The average eCommerce business publishes 4.55 posts a week on its Facebook page.
- In 2021, Facebook and Instagram (owned by Facebook) are set to spend $95 billion on ads.
- More than a third of US consumers purchased products through social media in 2019.
- Marketers sharing video content on LinkedIn is projected to grow to 65% in 2021.
- 70% of Instagram users find new products on the platform.
- 30% of online shoppers say they’d likely make a purchase from a social media network like Facebook, Instagram, Pinterest, Twitter, etc.
- About 55% of Gen Z internet users - and nearly as many Millennials - said their clothing purchases were influenced by posts they saw on social media platforms.
- TikTok allows users to add eCommerce links to their profile bio.
- The bulk of social commerce in the US happens on Facebook and Instagram.
- 55% of online shoppers tell friends and family when they’re unhappy with a product or company. Social media is a popular place to do that.
- 74% of consumers rely on insights from their social networks to make purchasing decisions.
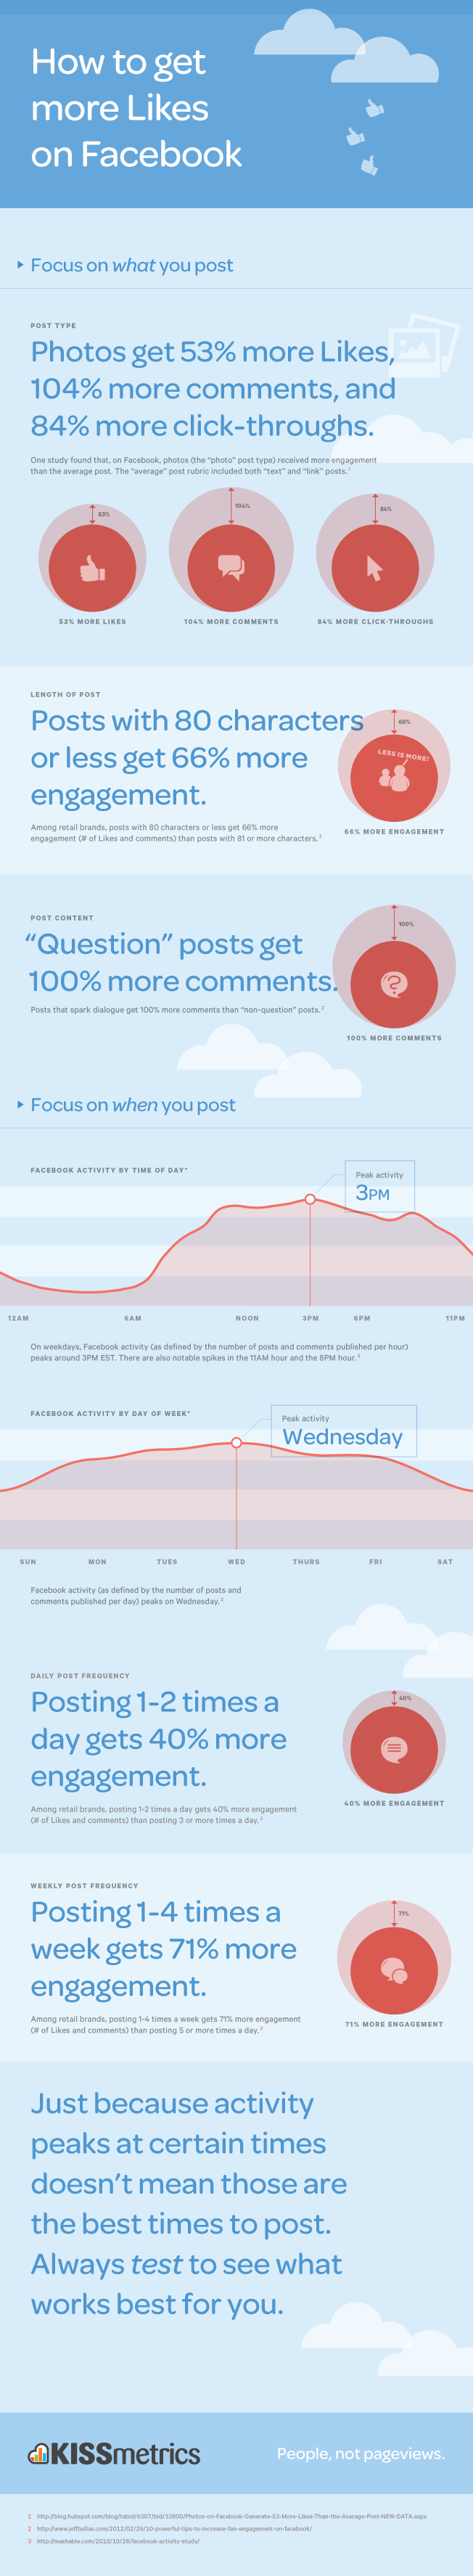
- Social media posts with photos have an 84% higher click-through rate, along with 53% more likes and 104% more comments.
- After looking at an Instagram advertising post, 75% have taken an action, such as visiting a website.
- The average value of orders originating on Instagram is $65.00, followed by Pinterest ($58.95), Facebook ($55), Twitter ($46), LinkedIn ($44.24), and YouTube ($38).
- Shorter social media posts - 80 characters or less - get 66% more engagement than longer posts.
- 50% of Gen Z shoppers and 48% of Millennials have made purchases either directly by clicking on a post or later on because of an influencer’s endorsement.
- US shoppers check out social media when purchasing gifts for family and friends at a rate of 25%.
Mobile eCommerce Statistics
How much of your total eCommerce sales are completed using a mobile device? Just knowing that statistic alone should influence how much you invest in ensuring every aspect of your eCommerce business is optimized for mobile.
If your site doesn’t show up in Google Shopping search results and look good on their smartphones, consumers will look elsewhere.
- Mobile accounts for 61% of online retail traffic.
- During the holiday season, mobile retail eCommerce sales volumes have gone from $30.59 billion in 2016 to $71.31 billion in 2020.
- mCommerce (mobile commerce) accounted for 40% of online purchases made during the holiday season.
- In 2018, Black Friday and Cyber Monday surpassed $2 billion in mCommerce sales.
- 33.6% of consumers use their smartphones to look up price comparisons while shopping in a physical store.
- In the first quarter of 2019, 65% of retail site visits worldwide happened on a smartphone.
- Mobile device users spend 90% of their time on apps.
- 45% of eCommerce sales in the US happen on a mobile device.
- Statista estimates that by the end of 2021, 72.9% of eCommerce sales will happen on a mobile device.
- 79% of smartphone users made an online purchase using their mobile device in the last six months.
- 53% of consumers who shop online every day use their smartphones to make those purchases.
- 82% of US internet users have shopped online with their mobile devices.
- 36% of consumers who say they only shop online once a year prefer smartphones over other devices.
- 16% of consumers used their smartphone to complete a purchase more than once a week in 2019; that percentage rose to 18% in 2020.
- After one negative experience on a mobile website, 62% are less likely to return and purchase from that business.
- As page load time increases from 1 second to 3, the probability of bounce increases 32%; at 5 seconds, it increases 90%.
- According to IBM’s US Retail Index, the COVID-19 pandemic has accelerated the shift to online shopping by roughly five years.
- 93% of Millennials use their mobile devices to compare online deals before making a purchase.
- 58% of Millennials prefer smartphones for shopping online, followed by Gen Z at 49%, Gen X at 48%, and Baby Boomers at just 18%.
- 80.64% of mobile users in the US say they’ve accessed the Amazon app; 46.08% use the Walmart app, and 33.2% use the eBay app. Ibotta and Target nearly tie up at fourth and fifth places (25.2% and 24.31%, respectively).
- The use of mobile payments - through applications like PayPal, Apple Pay, etc. - is set to continue its unstoppable growth of 26.93% between 2020 - 2025.
- 45% of eCommerce payments are made via mobile and digital wallets.
- The use of mobile/eWallet payments is set to become the second most common payment method (after debit cards) by 2022.
- 80% of US consumers have never used a tap-to-pay method; the opposite is true for 80% of UK and Australian consumers.
- Since 87% of shoppers use their smartphones to conduct online product research before buying, marketers now expect mCommerce to become the main channel for online shopping.
- 43% of smartphone users consider online shopping one of their top activities.
- 67% of consumers who “window-shop” online do it just for fun, and 77% of those end up making impulse purchases.
- 88% of consumers who use their phones to search for a local business end up going to that business within 24 hours.
- The average conversion rate of mobile popups is 5.8%.
- Conversion rates are 3X higher when shoppers use a mobile app (as opposed to visiting a mobile website).
- If your mobile site is poorly designed, 73% of online shoppers will find a site that is easier to make purchases.
- CTA buttons result in a boost of 45% in clicks.
Shopping Cart eCommerce Statistics
It’s only the beginning when a consumer adds one of your products to their online shopping cart. Too often, the cart is where shopper interest goes to die.
So, what are the statistics of online shopping cart abandonment? And how do you draw those customers back to complete their purchases? Why do they abandon them in the first place?
Abandoned carts happen even when you do everything right. But if you can’t stop customers from closing the tab after they “add to cart,” there are ways to bring them back.
- The average shopping cart abandonment rate stands at 69.80%, costing eCommerce sites $3 billion a year.
- The average open rate of abandoned cart emails is 45%.
- The abandonment rate is 75% on slow-loading sites.
- Of all devices used to make online purchases, smartphones have the worst cart abandonment rate at 78%, followed by tablets (70%) and desktops/laptops (67%).
- The top reason shoppers abandon carts are the high extra costs.
- 76% of consumers admit to being dissuaded from making a purchase when shipping costs were too expensive.
- Setting aside those who are “just browsing,” 49% admit they’ve bailed after seeing the added costs in shipping, tax, and fees.
- The average checkout has 14.88 form fields; most sites can reduce that by 20-60% to streamline (i.e., speed up) the process.
- 46.5% of small to mid-sized businesses (SMB) report increased profits after offering free shipping.
- 23% of consumers will abandon carts if you require them to create an account during checkout.
- Follow-up emails for an abandoned cart have an average open rate of 41.09 percent.
- Exit-Intent popups persuade 53% of abandoning visitors to stay.
- An optimized checkout design can increase conversion rates by 35% for eCommerce sites.
- Over 392 million people in the world have active PayPal accounts.
- In North America, credit cards are the number one payment method by a mile. Digital payment systems like PayPal and Apple Pay are next in line. Both payment forms dominate global eCommerce.
- 85% of US retail locations support Apple Pay as a payment method.
- 82% of US shoppers would buy more to reach a minimum spending amount to get free shipping or delivery.
- Clothing has the highest abandonment rate (40%). Tech comes in second at 18% and home products round up the top 3 at 16%.
Which eCommerce Statistics Will You Put to Use?
What aspect of your eCommerce business needs the most attention right now?
Maybe you’ve been curious about establishing a social commerce presence on Facebook, Instagram, or another platform favored by your customers.
Or maybe your minimalist approach to email marketing needs an upgrade.
Every business out there has room for improvement.
Bookmark our monster list of eCommerce statistics, and choose which ones stood out as especially relevant to your business.
And implement them for your eCommerce business today!


